
Note
New to DeepInverse? Get started with the basics with the 5 minute quickstart tutorial..
Multi-distance Fresnel phase retrieval#
This example reconstructs projected phase from preprocessed near-field holograms acquired at several propagation distances, see e.g. Huhn et al.[1] for details on the physics.
For each distance \(z_j\), the forward model applies the phase-only transmission and Fresnel propagation, then records intensity:
where \(\mathcal{P}_{z_j}\) is FresnelPropagation and \(\phi\) is the phase to be reconstructed.
import torch
import deepinv as dinv
import matplotlib.pyplot as plt

device = dinv.utils.get_device()
Selected GPU 0 with 4267.25 MiB free memory
Get physical parameters and load data#
The holograms were acquired at a wavelength \(\lambda=0.155\text{nm}\) and the pixel size in the object plane is \(196\text{nm}\). The sample scanned consists of polysysterene spheres with a diameter of \(15\mu\text{m}\). In terms of dimension, the measurements are of shape \(2048\times1920\) pixels, but we downsample them for computational feasibility.
Tip
Set ds = 1 to run the example at full resolution.
wavelength = 1.5498e-10
pixel_size = 196e-9

# downsampling factor for computational feasibility
ds = 8

# load data from HuggingFace
data = dinv.utils.load_example("holograms_multidistance_hotopy.npz")
y = data["holograms"].to(device)
fresnel_numbers = data["fresnelNumbers"].tolist()

# apply downsampling
y = y.reshape(
    -1, len(fresnel_numbers), 1, y.shape[-2] // ds, ds, y.shape[-1] // ds, ds
).mean(
    dim=(-3, -1)
)  # (B, D, 1, H, W) batch size, distances, channel, height, width
fresnel_numbers = [fn * ds**2 for fn in fresnel_numbers]

# split the distance dimension into a TensorList with one (B, 1, H, W) tensor per distance,
y = dinv.utils.TensorList(list(y.unbind(dim=1)))

height, width = y[0].shape[-2:]
img_size = (1, height, width)
print([yi.shape for yi in y])  # D tensors of shape (B, 1, H, W)

distances = [(pixel_size * ds) ** 2 / (wavelength * fn) for fn in fresnel_numbers]
[torch.Size([1, 1, 256, 240]), torch.Size([1, 1, 256, 240]), torch.Size([1, 1, 256, 240]), torch.Size([1, 1, 256, 240])]
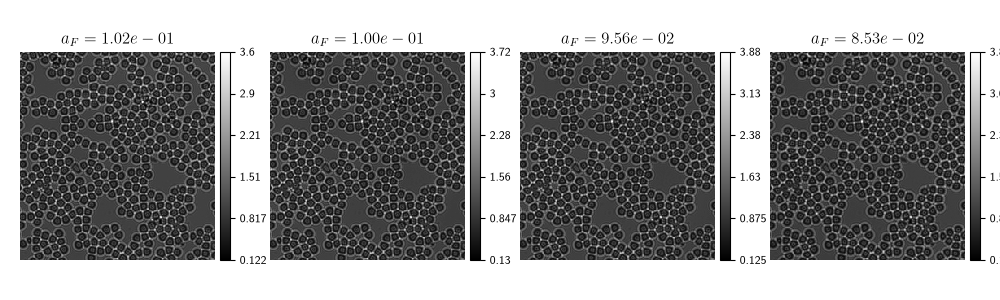
The Fresnel number \(a_F\) is defined as
where \(a\) is the characteristic size of the object, typically the pixel size, \(\lambda\) the wavelength, and \(z\) the propagation distance. Hence, it is also affected by downsampling the data. As you see in the last line above, we calculate the propagation distances from the Fresnel numbers.
# visualize the measurements
dinv.utils.plot(
    list(y),
    titles=[rf"$a_F={fn:.2e}$" for fn in fresnel_numbers],
    figsize=(10, 3),
    cmap="gray",
    cbar=True,
    dpi=200,
)
/local/pberna03/actions-runner/_work/deepinv/deepinv/deepinv/utils/plotting.py:550: UserWarning: set_ticklabels() should only be used with a fixed number of ticks, i.e. after set_ticks() or using a FixedLocator. Otherwise, ticks may be mislabeled.
  colbar.set_ticklabels(true_labels)
/local/pberna03/actions-runner/_work/deepinv/deepinv/deepinv/utils/plotting.py:550: UserWarning: set_ticklabels() should only be used with a fixed number of ticks, i.e. after set_ticks() or using a FixedLocator. Otherwise, ticks may be mislabeled.
  colbar.set_ticklabels(true_labels)
/local/pberna03/actions-runner/_work/deepinv/deepinv/deepinv/utils/plotting.py:550: UserWarning: set_ticklabels() should only be used with a fixed number of ticks, i.e. after set_ticks() or using a FixedLocator. Otherwise, ticks may be mislabeled.
  colbar.set_ticklabels(true_labels)
/local/pberna03/actions-runner/_work/deepinv/deepinv/deepinv/utils/plotting.py:550: UserWarning: set_ticklabels() should only be used with a fixed number of ticks, i.e. after set_ticks() or using a FixedLocator. Otherwise, ticks may be mislabeled.
  colbar.set_ticklabels(true_labels)
/local/pberna03/actions-runner/_work/deepinv/deepinv/deepinv/utils/plotting.py:570: UserWarning: This figure was using a layout engine that is incompatible with subplots_adjust and/or tight_layout; not calling subplots_adjust.
  plt.subplots_adjust(hspace=0.2, wspace=0.2)
Define transmission model & stacked forward model#
Via the transmission model, we decide how the object is mapped to the complex field.
Usually the object consists of a phase-shifting part \(\phi \leq 0\) and an absorption part \(\mu \geq 0\) . In this example, we follow Huhn et al.[1] and assume that the object is purely phase-shifting, i.e. \(\mu=0\), and thus the transmission model which is generally given by \(A(\phi) = \exp(i \phi - \mu)\) simplifies to \(A(\phi) = \exp(i \phi)\).
To work with a non-negative variable, we reconstruct \(-\phi\) instead of \(\phi\), which slightly changes the code. This is needed for DRUNet to work properly, as it was trained on non-negative images and does not handle sign-flipped inputs, so we reconstruct the non-negative quantity \(-\phi\).
transmission = dinv.physics.Physics(A=lambda x: torch.exp(-1j * x))

# Build the stacked physics step-by-step for each distance
physics_list = []
for dist in distances:
    fresnel = dinv.physics.FresnelPropagation(
        distance=dist,
        img_size=img_size,
        wavelength=wavelength,
        pixel_size=pixel_size * ds,
        device=device,
    )
    phase_retrieval = dinv.physics.PhaseRetrieval(B=fresnel)
    single_physics = dinv.physics.compose(transmission, phase_retrieval)
    physics_list.append(single_physics)

physics = dinv.physics.stack(*physics_list)
Reconstruction using proximal gradient descent (PGD) and Tikhonov prior#
data_fidelity = dinv.optim.StackedPhysicsDataFidelity(
    [dinv.optim.L2() for _ in distances]
)


class NonNegativeTikhonov(dinv.optim.Tikhonov):
    r"""Tikhonov prior whose proximal step also projects onto :math:`\phi\leq0`."""

    def prox(self, x, *args, gamma=1.0, **kwargs):
        return super().prox(x, gamma=gamma).clamp_min(0)


reconstructor_pgd = dinv.optim.PGD(
    data_fidelity=data_fidelity,
    prior=NonNegativeTikhonov(),
    lambda_reg=3e-2,
    stepsize=0.1,
    max_iter=300,
    backtracking=dinv.optim.BacktrackingConfig(eta=0.5, max_iter=10),
)

initial_phase = torch.zeros(y[0].shape[0], 1, height, width, device=device)
phase_estimate_pgd, metrics_pgd = reconstructor_pgd(
    y,
    physics,
    init=initial_phase,
    compute_metrics=True,
)

# Reconstructed image = estimated phase map of shape (1,1,H,W)
print(phase_estimate_pgd.shape)
torch.Size([1, 1, 256, 240])
Plug-and-Play (PnP) reconstruction#
Using DRUNet as a pretrained denoiser inside the PGD Plug-and-Play framework.
denoiser = dinv.models.DRUNet(
    in_channels=1, out_channels=1, pretrained="download", device=device
)


class NonNegativePnP(dinv.optim.PnP):
    r"""Non-negative prior whose proximal step also projects onto :math:`\phi\geq0`."""

    def prox(self, x, sigma_denoiser=0.1, *args, **kwargs):
        return super().prox(x, sigma_denoiser=sigma_denoiser).clamp_min(0)


reconstructor_pnp = dinv.optim.PGD(
    data_fidelity=data_fidelity,
    prior=NonNegativePnP(denoiser=denoiser),
    stepsize=0.1,
    sigma_denoiser=0.1,
    max_iter=30,
    custom_metrics={
        "DF": lambda _values, _x_prev, x_cur: data_fidelity(x_cur, y, physics).item()
    },
)


phase_estimate_pnp, metrics_pnp = reconstructor_pnp(
    y,
    physics,
    init=initial_phase,
    compute_metrics=True,
)
Visualization of the results and convergence#
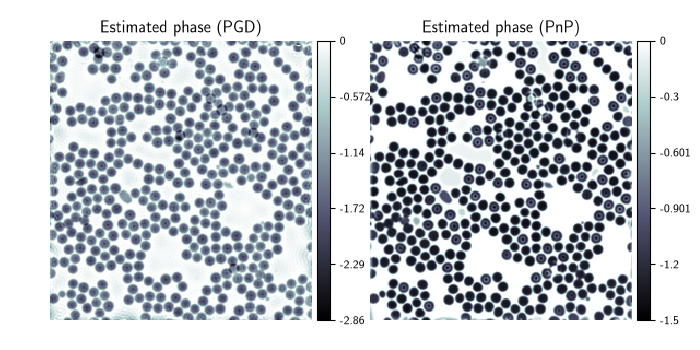
Flipping the sign again. Note that with the default downsampling the results are not comparable to Huhn et al.[1] which were computed at full resolution on a powerful GPU.
Note
To reproduce the results of Huhn et al.[1], set ds=1 above to run at full resolution (requires a more powerful GPU).
dinv.utils.plot(
    [-phase_estimate_pgd, -phase_estimate_pnp],
    titles=["Estimated phase (PGD)", "Estimated phase (PnP)"],
    figsize=(7, 3.5),
    cmap="bone",
    cbar=True,
    dpi=200,
)

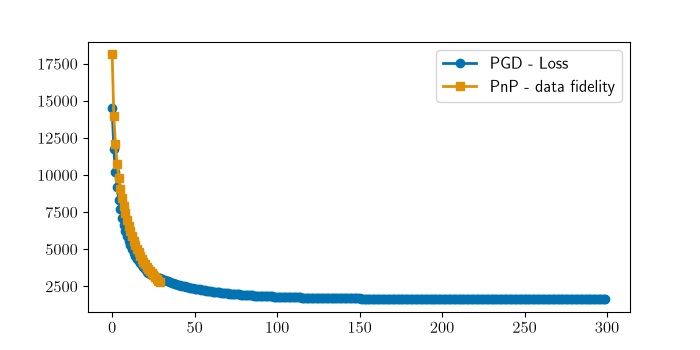
plt.figure(figsize=(7, 3.5))
plt.plot(metrics_pgd["cost"][0], label="PGD - Loss")
plt.plot(metrics_pnp["DF"][0], label="PnP - data fidelity")
plt.legend()
plt.show()
/local/pberna03/actions-runner/_work/deepinv/deepinv/deepinv/utils/plotting.py:550: UserWarning: set_ticklabels() should only be used with a fixed number of ticks, i.e. after set_ticks() or using a FixedLocator. Otherwise, ticks may be mislabeled.
  colbar.set_ticklabels(true_labels)
/local/pberna03/actions-runner/_work/deepinv/deepinv/deepinv/utils/plotting.py:550: UserWarning: set_ticklabels() should only be used with a fixed number of ticks, i.e. after set_ticks() or using a FixedLocator. Otherwise, ticks may be mislabeled.
  colbar.set_ticklabels(true_labels)
/local/pberna03/actions-runner/_work/deepinv/deepinv/deepinv/utils/plotting.py:570: UserWarning: This figure was using a layout engine that is incompatible with subplots_adjust and/or tight_layout; not calling subplots_adjust.
  plt.subplots_adjust(hspace=0.2, wspace=0.2)
- References:
Total running time of the script: (0 minutes 18.561 seconds)
